- USD/JPY bounces off intraday low but remains in the red for the third consecutive day.
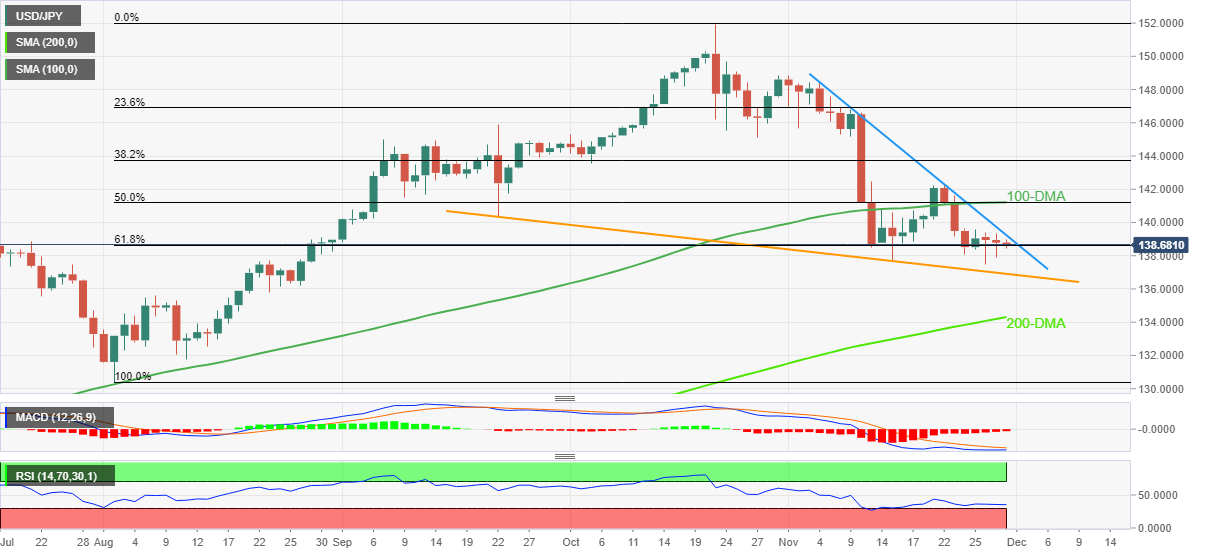
- Three-week-old descending trend line restricts immediate upside, downward-sloping support line from late September lures bears.
- Convergence of 100-DMA, 50% Fibonacci retracement level appears as the key.
USD/JPY prints mild losses around 138.70 during the three-day losing streak amid early Wednesday. Even so, the quote bounces off intraday low of late to test the bears.
The yen pair’s latest losses could be linked to the failure to cross the key resistance line stretched from early November, around 139.20 by the press time. Also likely to favor the USD/JPY sellers are the bearish MACD signals and the downbeat RSI.
It’s worth noting that the quote’s further declines appear limited as the RSI (14) line is near the oversold territory. As a result, a descending support line from late September, near 136.90, appears crucial for USD/JPY bears to watch
In a case where the Yen pair remains bearish past 136.90, the odds of witnessing a south-run towards the early August top surrounding 135.60 and then to August month’s low near 130.40, can’t be ruled out.
Alternatively, a clear upside break of the aforementioned resistance line isn’t an open welcome for the USD/JPY buyers as a convergence of the 100-DMA and the 50% Fibonacci retracement level of the pair’s August-October upside will challenge the further advances near 141.25.
To sum up, USD/JPY is likely to decline further but the room towards the south is limited.
Trend: Further downside expected
USD/JPY: Daily chart


No comments:
Post a Comment